
- Standard procedure of analyzing scRNA data
- Pre-processing (10x; cellranger)
- Quality control (filter; doublets)
- Normalization
- Data correction and integration
- Feature selection
- Dimensionality reduction and visualization
- Cluster analysis and annotation
- Compositional analysis
- Trajectory analysis
- Gene-level analysis (DEGs, Enrichment, GRN)
- Basic concepts
- Annotated data -- AnnData
Standard procedure of analyzing scRNA data
Pre-processing (10x; cellranger)
Collect data from 10x. Then use cellranger, a commercial software for data pre-processing, to get cell count matrix.
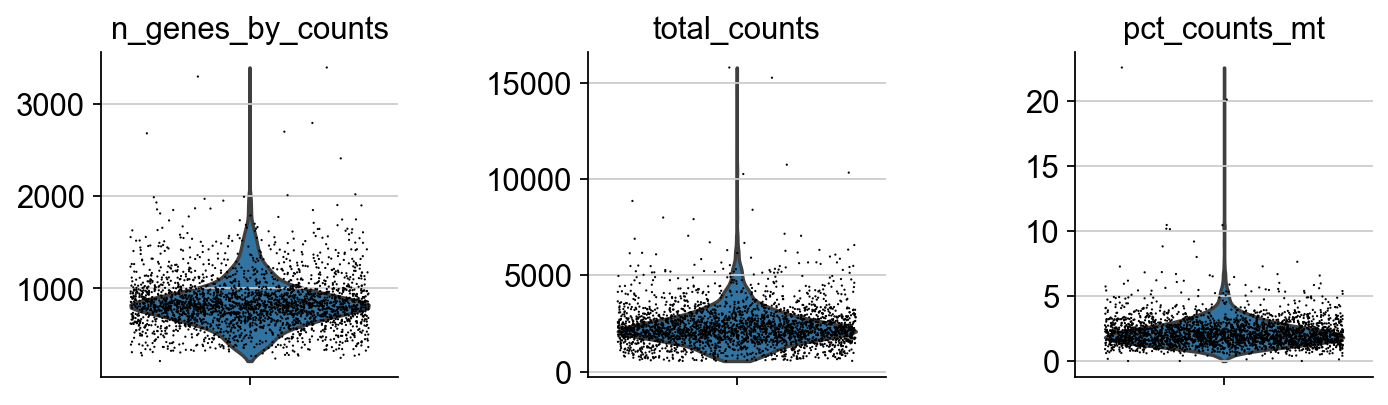
Quality control (filter; doublets)
After getting count matrix, quality control (QC) is needed to be implemented first. The purpose of QC has two sides. Firstly, we have to remove data of low quality, which may reflect the results of analysis. Then, we can examine the distribution of the collected data. In the following figure, every point denotes a cell. Plots in this figure respectively describes the genes detected of each single cell, the number of counts (?), and the proportion of mitochondrial genes.
After the general steps of quality control are implemented, it is also of great importance to deal with "doublets". Normally, one droplet only contains a single cell. However, restricted to the current technology, it is possible to obtain two cells in a droplet. The existing of double cells may lead to errors in the following analyzing steps. Currently, common ways to do doublets deletion are python-based (DoubletDetection) and R-based (DoubletFinder).
Normalization
For 10x scRNA-seq data, mainstream method is to normalize the counts to 10000, then take log function.
Data correction and integration
Due to the limitation of current technologies, some genes with low expression levels may not be detected. The aim of data correction is to do imputation, recover the true expression data. Novel method to do imputation is MAGIC, kNN-smoothing and SAVER. However, we have to clarify that the imputation may not make a difference to the downstream analysis, the main idea of imputation is to try to exhibit the whole gene profile.
At the same time, RNA data may be collected from different batches. To greatly analyze them, we need to do integration. Top3 methods to do integration according to prior study are Harmony, LIGER, and Seurat3.
Feature selection
The sparsity of scRAN-seq data is very large. Thus, we have to select features of high value and representative to do the following analysis.
Dimensionality reduction and visualization
Current ways to reduce dimensionality are UMAP, TSNE, LSI, PCA.
Cluster analysis and annotation
Compositional analysis
Trajectory analysis
Gene-level analysis (DEGs, Enrichment, GRN)
Basic concepts
箱型图 Box plot

In descriptive statistics, a box plot or boxplot is a method for graphically demonstrating the locality, spread and skewness groups of numerical data through their quartiles. Elements of a boxplot contain minimum ($Q_0$ or 0th percentile), maximum ($Q_4$ or 100th percentile), median ($Q_2$ or 50th percentile), first quartile ($Q_1$ or 25th percentile), third quartile ($Q_3$ or 75th percentile).
Annotated data -- AnnData


数据结构
| 结构 | 功能 | 数据类型 |
|---|---|---|
| adata.X | 矩阵数据 | numpy数组、scipy sparse矩阵 |
| adata.obs | 观测值数据 | pandas DataFrame |
| adata.var | 特征和高可变基因数据 | pandas DataFrame |
| adata.uns | 非结构化数据 | 字典dict |
adata.X本身不包含行名和列名信息,其行名和adata.obs共享,列名和adata.var共享
常用函数
# 数据数目统计
adata.n_obs # 返回细胞数
adata.n_vars # 返回基因数
adata.shape # 返回矩阵大小

# 数据键值提取
adata.obs_keys() # 获取细胞注释信息的Keys
adata.obs_names # 返回细胞ID,类型为Object
adata.var_index # 返回基因,类型为Object
adata.var_names.to_list() # 以List类型返回基因
adata.obs.head() # 查看Obs的前5行数据
